
ML: Decision trees from scratch
Written:
Machine Learning: An article explores decision trees and its evaluation.
Decision Tree Learning Algorithm
Objective: find a shorter tree that is as much consistent with the training examples as possible.
ID3 algorithm: (recursively) choose “most significant” attribute as root of a (sub)tree.
function DTL(examples, attributes, default) returens a decision tree
  if examples is empty
     return default
  else if all examples have the same classification
     return the classification
  else
     best-attribute = CHOOSE-ATTRIBUTE(attributes, examples)
     tree = a new decision tree with root best-attribute
     for each value vi of best-attribute do
        examples_i = {elements of examples with best = v_i}
        subtree = DTL(examples_i, (attribute - best), MODE(examples))
        add a branch to tree with label v_i and subtree subtree
     return tree
Hypothesis Evaluation
Confusion matrix
A confusion matrix, also known as an error matrix,is a specific table layout that allows visualization of the performance of an algorithm, typically a supervised learning one.
It is a special kind of contingency table, with two dimensions (“actual” and “predicted”), and identical sets of “classes” in both dimensions (each combination of dimension and class is a variable in the contingency table).
two rows and two columns that reports the number of false positives, false negatives, true positives, and true negatives.
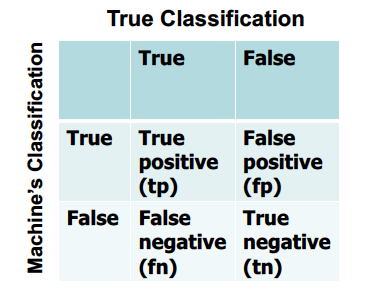
Figure 1. 2D Confusion Matrix
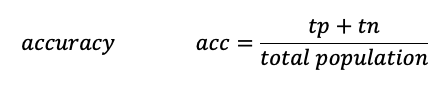
Accuracy is a description of systematic errors, a measure of statistical bias; as these cause a difference between a result and a “true” value, ISO calls this trueness.
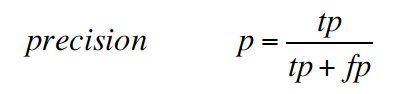
precision (also called positive predictive value) is the fraction of relevant instances among the retrieved instances.
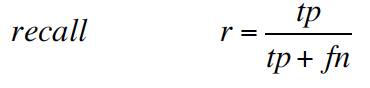
recall (also known as sensitivity) is the fraction of relevant instances that have been retrieved over the total amount of relevant instances.
In statistical analysis of binary classification, the F1 score (also F-score or F-measure) is a measure of a test’s accuracy. It considers both the precision p and the recall r of the test to compute the score: p is the number of correct positive results divided by the number of all positive results returned by the classifier, and r is the number of correct positive results divided by the number of all relevant samples (all samples that should have been identified as positive). The F1 score is the harmonic average of the precision and recall, where an F1 score reaches its best value at 1 (perfect precision and recall) and worst at 0.
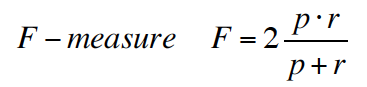
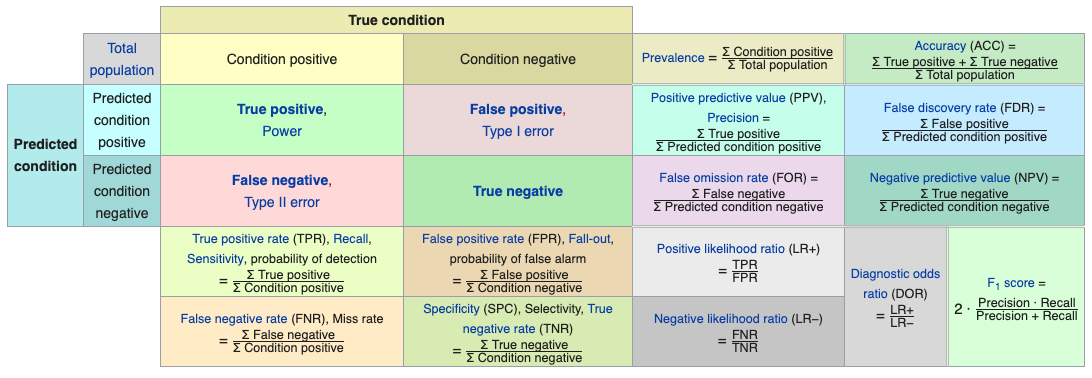
Figure 2. Confusion matrix with all performance measurements from Wikipedia page